Saybrook Station WWTP: Old Saybrook, CT
Saybrook Station WWTP: Old Saybrook, CT
Aesthetics & Footprint Main Project Drivers for Upscale WWTP on the Connecticut Shoreline
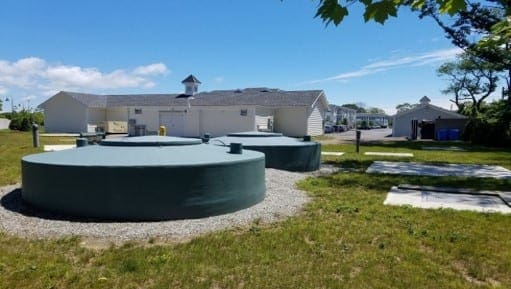
In 2015, developers needed a wastewater treatment solution for their state-of-the-art apartment complex in Old Saybrook, Connecticut. The developers of Post & Main, 186 garden style apartments spread over 10 acres on the Connecticut Shoreline, went above and beyond to give each apartment a luxurious feel – including private balconies, stainless steel appliances, accent lighting, & in-unit washer/dryers. Additionally, the development boasts a pool, lounge, fitness center, game rooms, and much more. So it stands to reason that when they looked for a way to treat the wastewater, they wanted to save money but more importantly make sure the footprint of the system was small enough not to infringe on the beauty of the apartment complex, all while treating the effluent to permit standards. Enter AquaPoint.
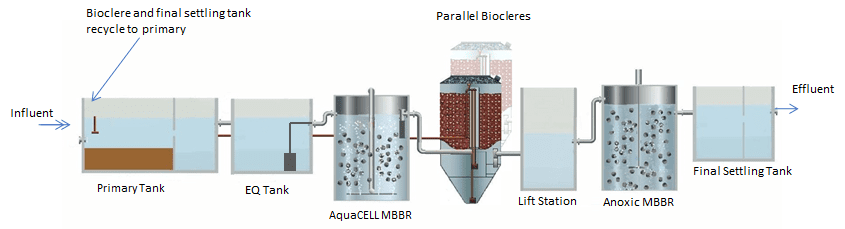
As is standard here at AquaPoint, we worked closely with the Consulting Engineers to design a system to specifically to meet the needs of the developer. Ultimately, we opted for one of our Bioclere-OH hybrid systems. This multi-stage, hybrid system integrates AquaCELL aerobic and anoxic MBBR chambers with two of our Bioclere trickling filters in between. The system was installed in 2016 and to date is consistently achieving effluent standards.
Design Characteristics
| Influent | Effluent | |
| DESIGN FLOW (GPD) | 41,850 | 41,850 |
| DESIGN TEMP (C) | 10 | – |
| BOD5 (mg/l) | 300 | < 20 |
| TSS (mg/l) | 200 | < 20 |
| TKN (mg/l) | 50 | – |
| TOTAL‐N (mg/l) | – | 10 |
| TOTAL – P (mg/l) | – | 15 |
Performance Data
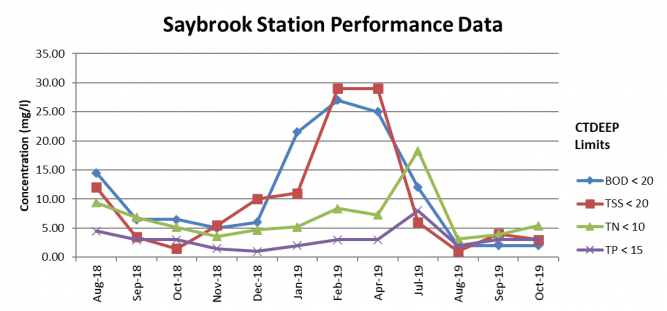
- System Commissioned: November 2016
- Detectable Limit for BOD & TSS: 2 & 1 mg/l respectively
- Data Source: Environmental Consulting Laboratories
| DATE | BOD5 (mg/l) | TSS (mg/l) | TN (mg/l) | TP (mg/l) |
|---|---|---|---|---|
| AUG. 2018 | 14.50 | 12.00 | 9.37 | 4.50 |
| SEP. 2018 | 6.50 | 3.50 | 6.84 | 3.00 |
| OCT. 2018 | 6.50 | 1.50 | 5.15 | 3.00 |
| NOV. 2018 | 5.00 | 5.50 | 3.60 | 1.50 |
| DEC. 2018 | 6.00 | 10.00 | 4.69 | 1.00 |
| JAN. 2019 | 21.50 | 11.00 | 5.22 | 2.00 |
| FEB. 2019 | 27.00 | 29.00 | 8.37 | 3.00 |
| APR. 2019 | 25.00 | 29.00 | 7.28 | 3.00 |
| JUL. 2019 | 12.00 | 6.00 | 18.31 | 8.00 |
| AUG. 2019 | 2.00 | 1.00 | 3.13 | 2.00 |
| SEP. 2019 | 2.00 | 4.00 | 3.92 | 3.00 |
| OCT. 2019 | 2.00 | 3.00 | 5.43 | 3.00 |
| AVG. | 10.83 | 9.63 | 6.78 | 3.08 |
System Diagram