Parker Terrace WWTP: Easton, MA
Parker Terrace WWTP: Easton, MA
Replacing a Conventional Septic System to Reduce Total Nitrogen & Organic Carbon
The inception of this system dates back to 2009, when the Mass. Department of Environmental Protection (MADEP) determined that the communities’ three conventional septic systems had failed and were polluting the local groundwater. On top of needing to replace the existing wastewater infrastructure, the Easton Housing Authority (EHA) also had new regulations to deal with, including reduction of total nitrogen (TN) & total organic carbon (TOC). Finally, given the system’s proximity to a municipal water well, AquaPoint & the Consulting Engineering firm certainly had many challenges to overcome.
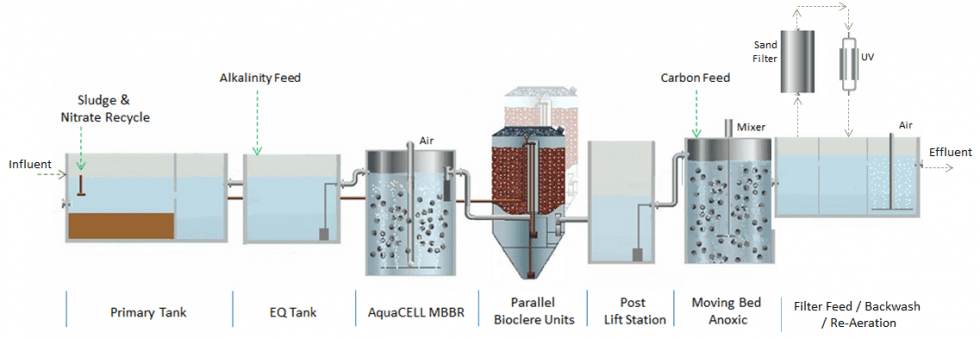
When factoring in the primary drivers for this project – effluent standards, cost efficiency, small footprint, and sustainability – Graves Consulting Engineers decided to install an AquaPoint Bioclere-OH wastewater treatment system. This multi-stage, hybrid system integrates AquaCELL aerobic and anoxic MBBR chambers with two of our Bioclere trickling filters in between. Treated effluent flows through a tertiary stage sand filter, activated carbon filters and UV disinfection prior to discharge. This system helps offset other costs as the effluent is used for irrigation throughout the grounds of the housing complex. The data set on the backside of this page will show the stable & effective performance of this system.
Design Characteristics
| Influent | Effluent | |
| DESIGN FLOW (GPD) | 30,000 | 30,000 |
| DESIGN TEMP (C) | 10 | – |
| BOD5 (mg/l) | 250 | < 30 |
| TSS (mg/l) | 250 | < 30 |
| TKN (mg/l) | 45 | – |
| TOTAL‐N (mg/l) | – | 10 |
| TOTAL – C (mg/l) | – | 4 |
Performance Data

- System Commissioned: September 2015
- Detectable Limit for BOD & TSS: 2 & 3 mg/l respectively
- Data Source: RI Analytical Labs
| DATE | BOD5 (mg/l) | TSS (mg/l) | TN (mg/l) | TOC (mg/l) |
|---|---|---|---|---|
| FEB. 2024 | 4.00 | 2.00 | 3.89 | 5.17 |
| MAR. 2024 | 4.00 | 2.00 | 2.02 | 2.38 |
| APR. 2024 | 4.00 | 2.20 | 2.96 | 2.59 |
| MAY 2024 | 3.50 | 4.75 | 2.48 | 3.34 |
| JUN. 2024 | 5.00 | 2.50 | 4.08 | 2.93 |
| JUL. 2024 | 4.00 | 2.40 | 3.55 | 3.25 |
| AUG. 2024 | 4.00 | 2.75 | 2.74 | 3.40 |
| SEP. 2024 | 7.30 | 3.33 | 2.85 | 1.20 |
| OCT. 2024 | 3.67 | 3.66 | 2.01 | 1.40 |
| NOV. 2024 | 3.75 | 3.93 | 1.92 | 2.47 |
| DEC. 2024 | 4.20 | 2.00 | 2.92 | 2.42 |
| JAN. 2025 | 4.00 | 12.80 | 2.16 | 2..67 |
| AVG. | 4.29 | 3.69 | 2.80 | 2.77 |
System Diagram