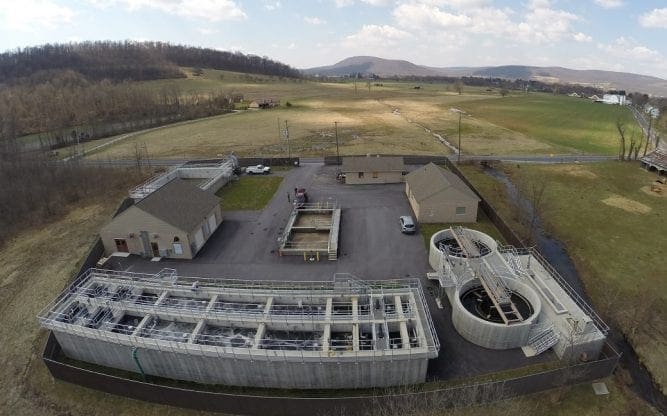
Fairfield, PA Municipal Wastewater Treatment Plant
Fairfield, PA Municipal Wastewater Treatment Plant
Chesapeake Bay Initiative Compliance on a Small Municipal Budget

The Town of Fairfield, PA was in a tough position. On one side, environmental regulations of the Chesapeake Bay Initiative were forcing an upgrade to a 40+ year old conventional activated sludge wastewater treatment plant. On the other, the extremely constrained economic environment made that a difficult proposition.
Consulting engineer C.S. Davidson, Inc. sought treatment technologies that could meet tight effluent standards for discharge to the Chesapeake Bay at a cost that was reasonable for a small town. Additionally, an aging collection system that suffered from persistent Infiltration & Inflow (I&I) required a solution that could treat the towns wastewater effectively under both average and significantly higher peak daily flow conditions. Design average and peak daily flow rates are 0.3 and 0.6 million gallons per day (MGD) respectively.
An AquaPoint AquaCELL™ Moving Bed Biofilm Reactor (MBBR) treatment system was specified for it’s proven enhanced nutrient removal (ENR) capability, ease of operation for the town’s two-man operations group and cost effective design. The AquaPoint treatment system was able to incorporate some tanks from the previous plant for aerobic digesters, further contributing to cost savings.
Design Characteristics
| Influent | Effluent | |
| PEAK FLOW (MGD) | 0.6 | 0.6 |
| AVG. FLOW (MGD) | 0.3 | 0.3 |
| DESIGN TEMP (C) | 10 | – |
| BOD5 (mg/l) | 250 | < 20 |
| TSS (mg/l) | 250 | < 20 |
| TKN (mg/l) | 40 | – |
| AMMONIA‐N (mg/l) | 35 | < 1 |
| TOTAL-N (mg/l) | – | < 8 |
| TOTAL-P (mg/l) | 12 | < 1 |
| FECAL (MPN/100ml) | – | <200 |
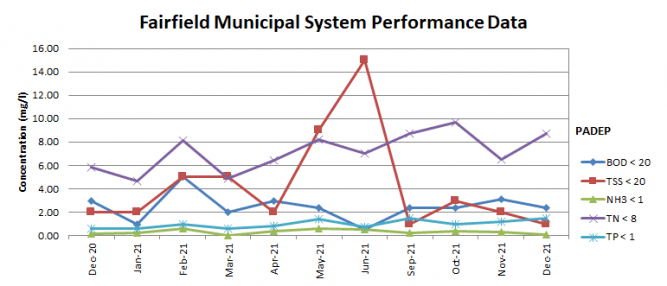
Performance Data

- System Commissioned: October 2012
- Detectable Limit for BOD & TSS: Permit based on total maximum annual load NOT effluent concentration
- Data Source: PA DEP Records
| DATE | BOD5 (mg/l) | TSS (mg/l) | Nh3 (mg/l) | TN (mg/l) | TP (mg/l) |
|---|---|---|---|---|---|
| DEC 2020 | 3.00 | 2.00 | 0.17 | 5.85 | 0.58 |
| JAN 2021 | 1.00 | 2.00 | 0.21 | 4.70 | 0.63 |
| FEB 2021 | 5.00 | 5.00 | 0.57 | 8.12 | 1.00 |
| MAR 2021 | 2.00 | 5.00 | 0.01 | 4.90 | 0.58 |
| APR 2021 | 3.00 | 2.00 | 0.37 | 6.45 | 0.79 |
| MAY 2021 | 2.40 | 9.00 | 0.62 | 8.22 | 1.40 |
| JUN 2021 | 0.50 | 15.00 | 0.55 | 7.06 | 0.78 |
| SEP 2021 | 2.40 | 1.00 | 0.62 | 8.22 | 1.40 |
| OCT 2021 | 2.40 | 3.00 | 0.39 | 9.72 | 1.00 |
| NOV 2021 | 3.10 | 2.00 | 0.27 | 6.50 | 1.20 |
| DEC 2021 | 2.40 | 1.00 | 0.10 | 8.72 | 1.50 |
| AVG. | 2.47 | 4.27 | 0.32 | 7.18 | 0.99 |
System Diagram


