Stop & Shop Wastewater Treatment Plant
Stop & Shop Wastewater Treatment Plant
Total Nitrogen Removal For High Strength Commercial Wastewater
Stop & Shop is one of the premier supermarket chains in New England. Prior to 1995, most stores that were constructed without access to municipal sewer infrastructure were installed with conventional septic tanks and drain fields.
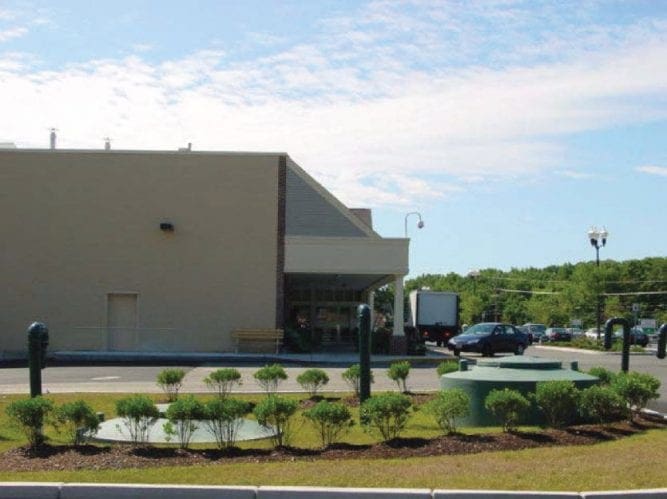
The high strength nature of waste streams from Stop & Shop facilities caused many of their drain fields to fail within 5-7 years and they budgeted accordingly for the expected replacement costs. In 1995 Stop & Shop installed their first AquaPoint Bioclere™ wastewater treatment system in an effort to preserve a store’s drain field. When an analysis several years later confirmed the field was as good as new, Stop & Shop determined that onsite treatment with a reliable, energy efficient biological treatment technology represented a 2-3 year return on investment. This store in Foxboro Massachusetts is one of 21 Bioclere™ systems serving Stop & Shop facilities throughout New England.
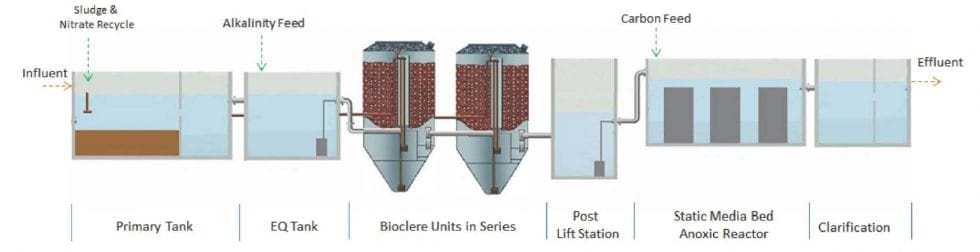
Stop & Shop’s Engineer selected an AquaPoint Bioclere ™ treatment system for its proven nitrification & denitrification performance capability, energy efficiency, ease of operation and small footprint. At the Foxboro facility, the Bioclere™ units are followed by a tertiary stage anoxic reactor for denitrification. Effluent from the plant is discharged through a conventional pressure dosed drain field.
Design Characteristics
| Influent | Effluent | |
| DESIGN FLOW (GPD) | 5,575 | 5,575 |
| DESIGN TEMP (C) | 10 | – |
| BODs (mg/l) | 800 | < 30 |
| TSS (mg/l) | 400 | < 30 |
| TKN (mg/l) | 100 | – |
| AMMONIA-N (mg/l) | 80 | < 2 |
| NITRATE-N (mg/l) | – | < 5 |
| TOTAL-N (mg/l) | – | < 10 |
Performance Data
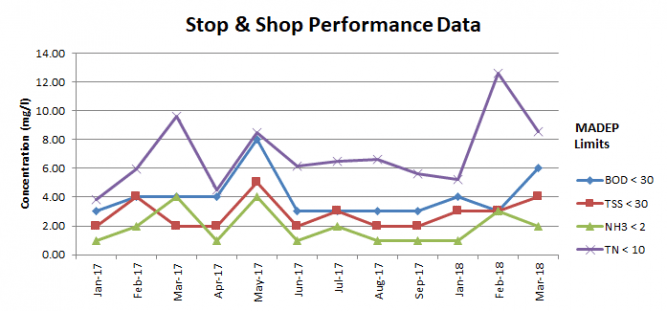
- System Commissioned: August 2001
- Detectable Limit for BOD & TSS: 3 & 2 mg/l respectively
- Data Source: MA DEP Records
| DATE | BOD5 (mg/l) | TSS (mg/l) | NH3 (mg/l) | TN (mg/l) |
|---|---|---|---|---|
| JAN. 2017 | 3.00 | 2.00 | 1.00 | 3.85 |
| FEB. 2017 | 4.00 | 4.00 | 2.00 | 5.93 |
| MAR. 2017 | 4.00 | 2.00 | 4.00 | 9.65 |
| APR. 2017 | 4.00 | 2.00 | 1.00 | 4.50 |
| MAY 2017 | 8.00 | 5.00 | 4.00 | 8.50 |
| JUN. 2017 | 3.00 | 2.00 | 1.00 | 6.15 |
| JUL. 2017 | 3.00 | 3.00 | 2.00 | 6.50 |
| AUG. 2017 | 3.00 | 2.00 | 1.00 | 6.64 |
| SEP. 2017 | 3.00 | 2.00 | 1.00 | 5.65 |
| JAN. 2018 | 4.00 | 3.00 | 1.00 | 5.25 |
| FEB. 2018 | 3.00 | 3.00 | 3.00 | 12.60 |
| MAR. 2018 | 6.00 | 4.00 | 2.00 | 8.55 |
| AVG. | 4.00 | 2.83 | 1.92 | 6.98 |
System Diagram